DATA DASHBOARDS for K-12

Transform your school district’s data into actionable insights.

Powerful, customizable reporting tools designed specifically for K-12 education leaders to make data-informed decisions with confidence.

Visualize what matters — from individual records to district-wide trends

Clevr transforms data into beautifully designed reports that include bar charts, pie graphs, heat maps, and line graphs — all branded to your district.

  • Access live data updates

  • Apply unlimited filters and save your preferences

  • Visualize your workflow stages and processes

  • Export reports in various formats

  • Ensure users see only the data they’re authorized to access

  • Transform complex data into meaningful visuals

  • Automate report generation and scheduling

  • Aggregate data from multiple sources

  • Customize colors and layouts to match your identity

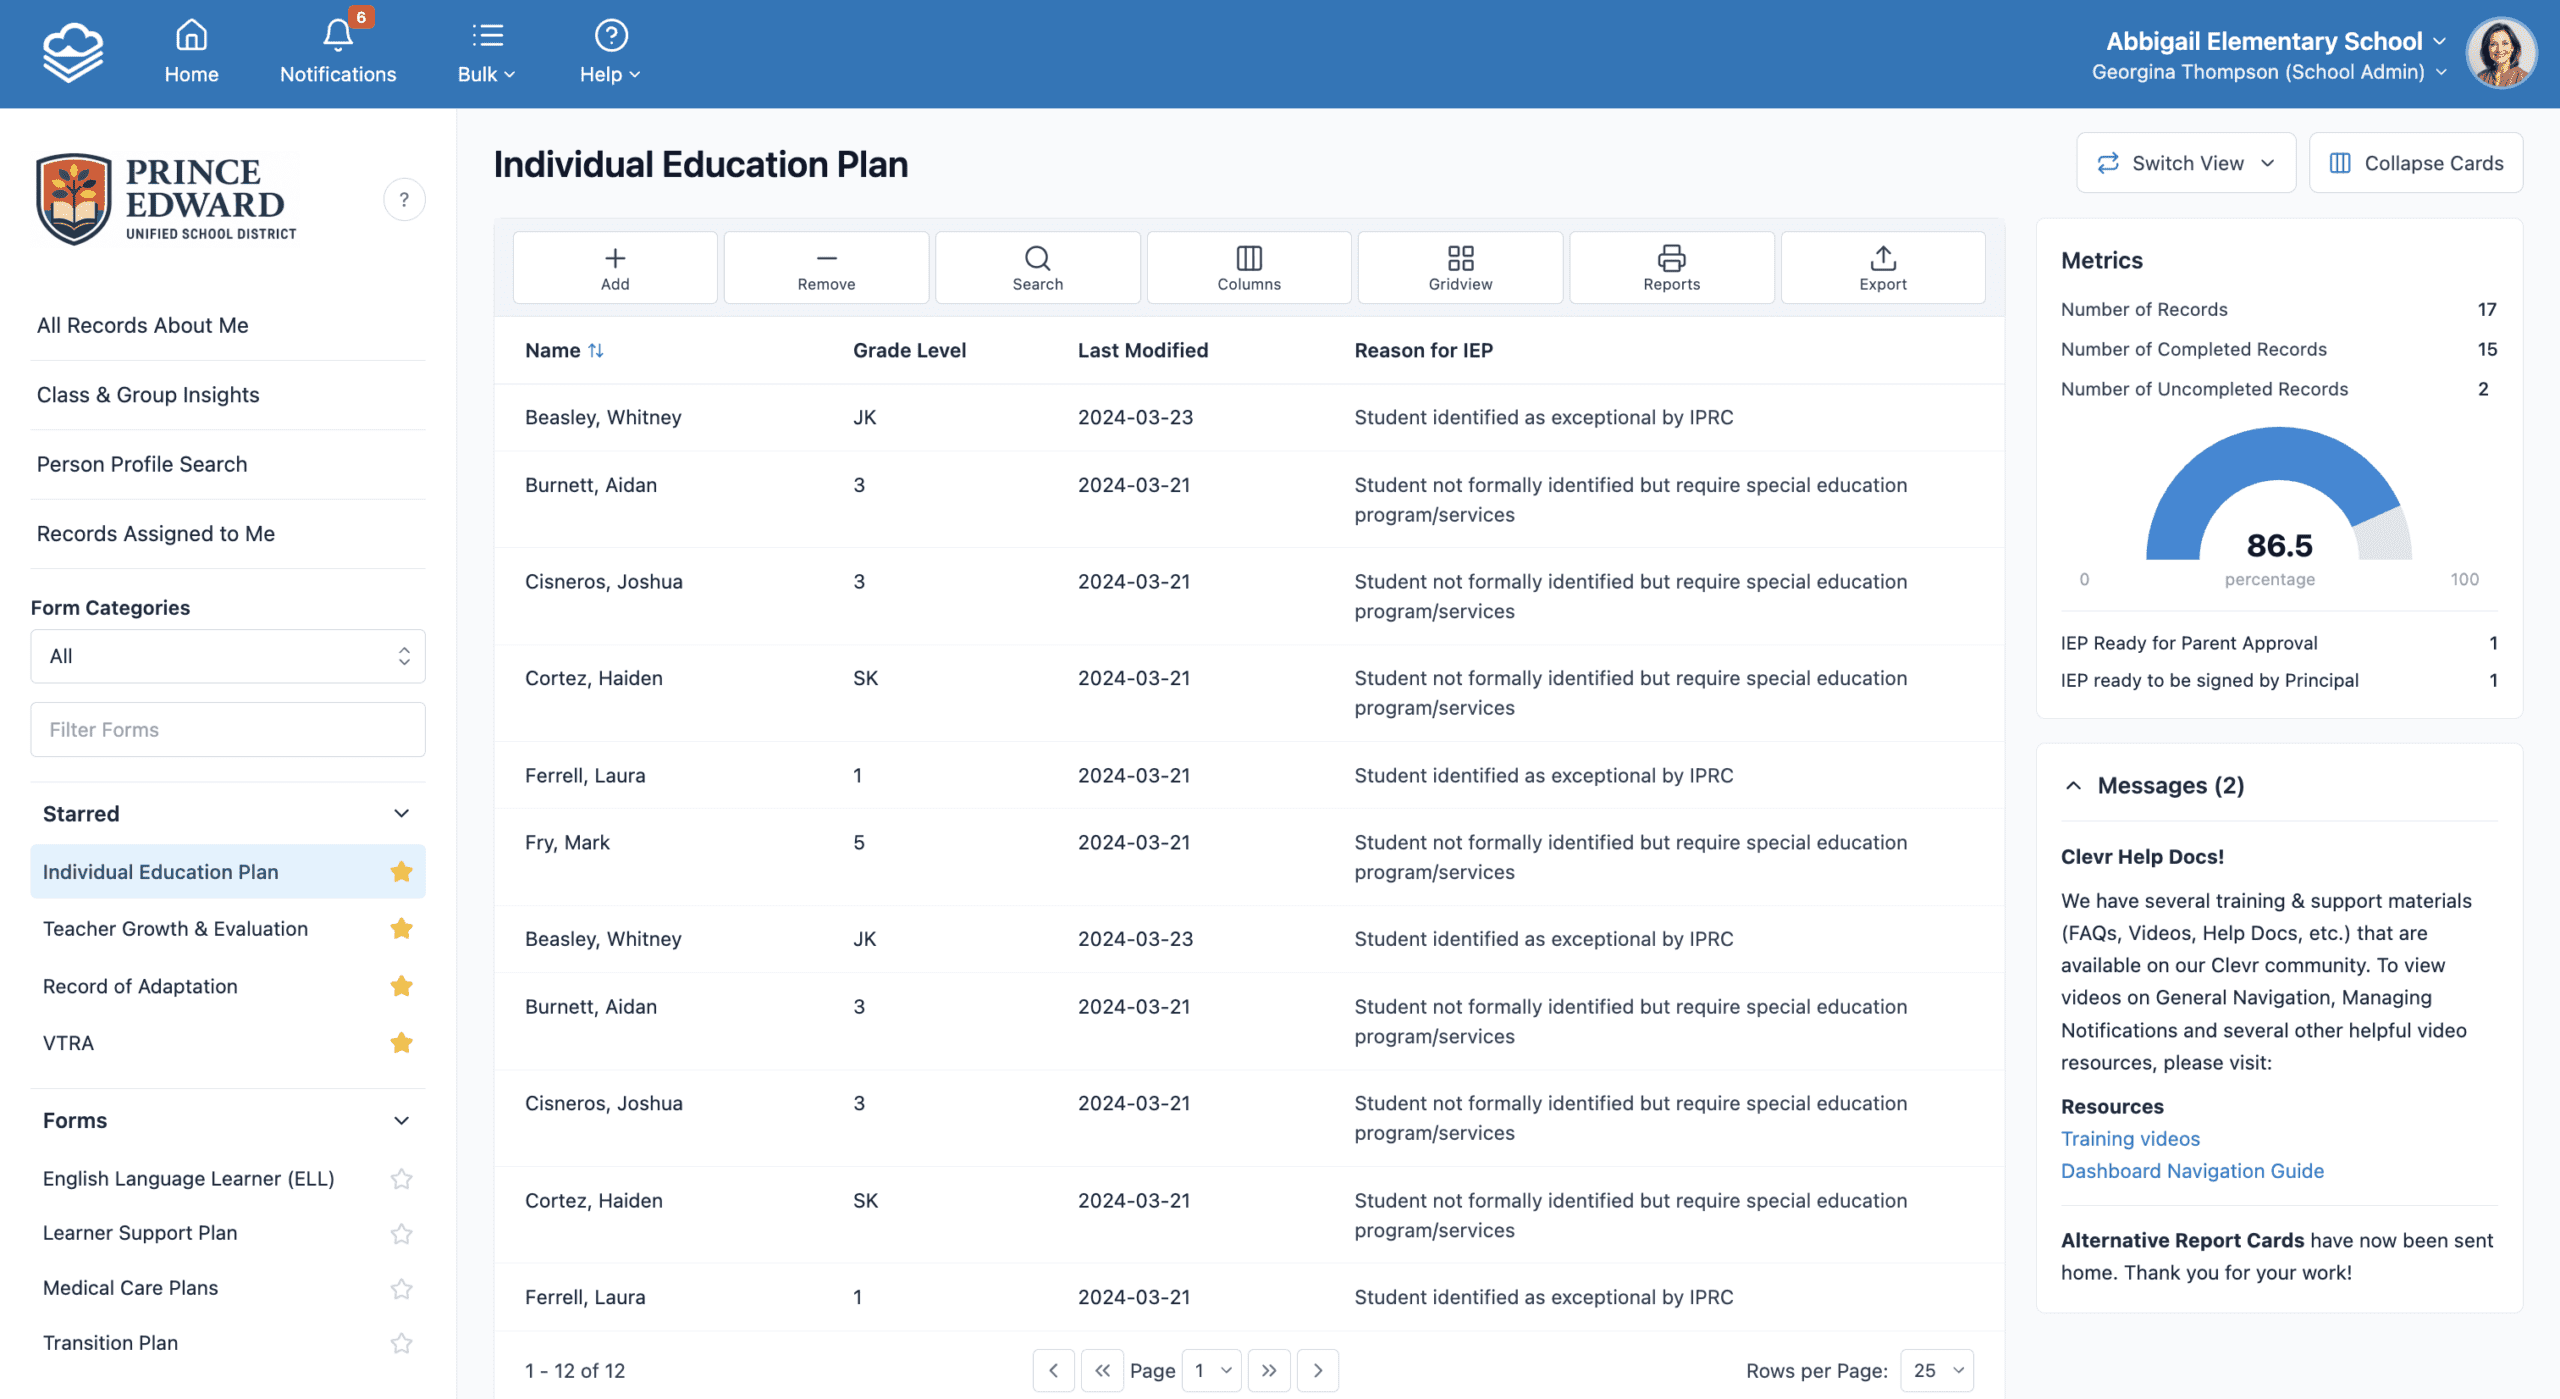
Role-Based Dashboards That Work the Way You Do

Interactive. Personalized. Built for action.

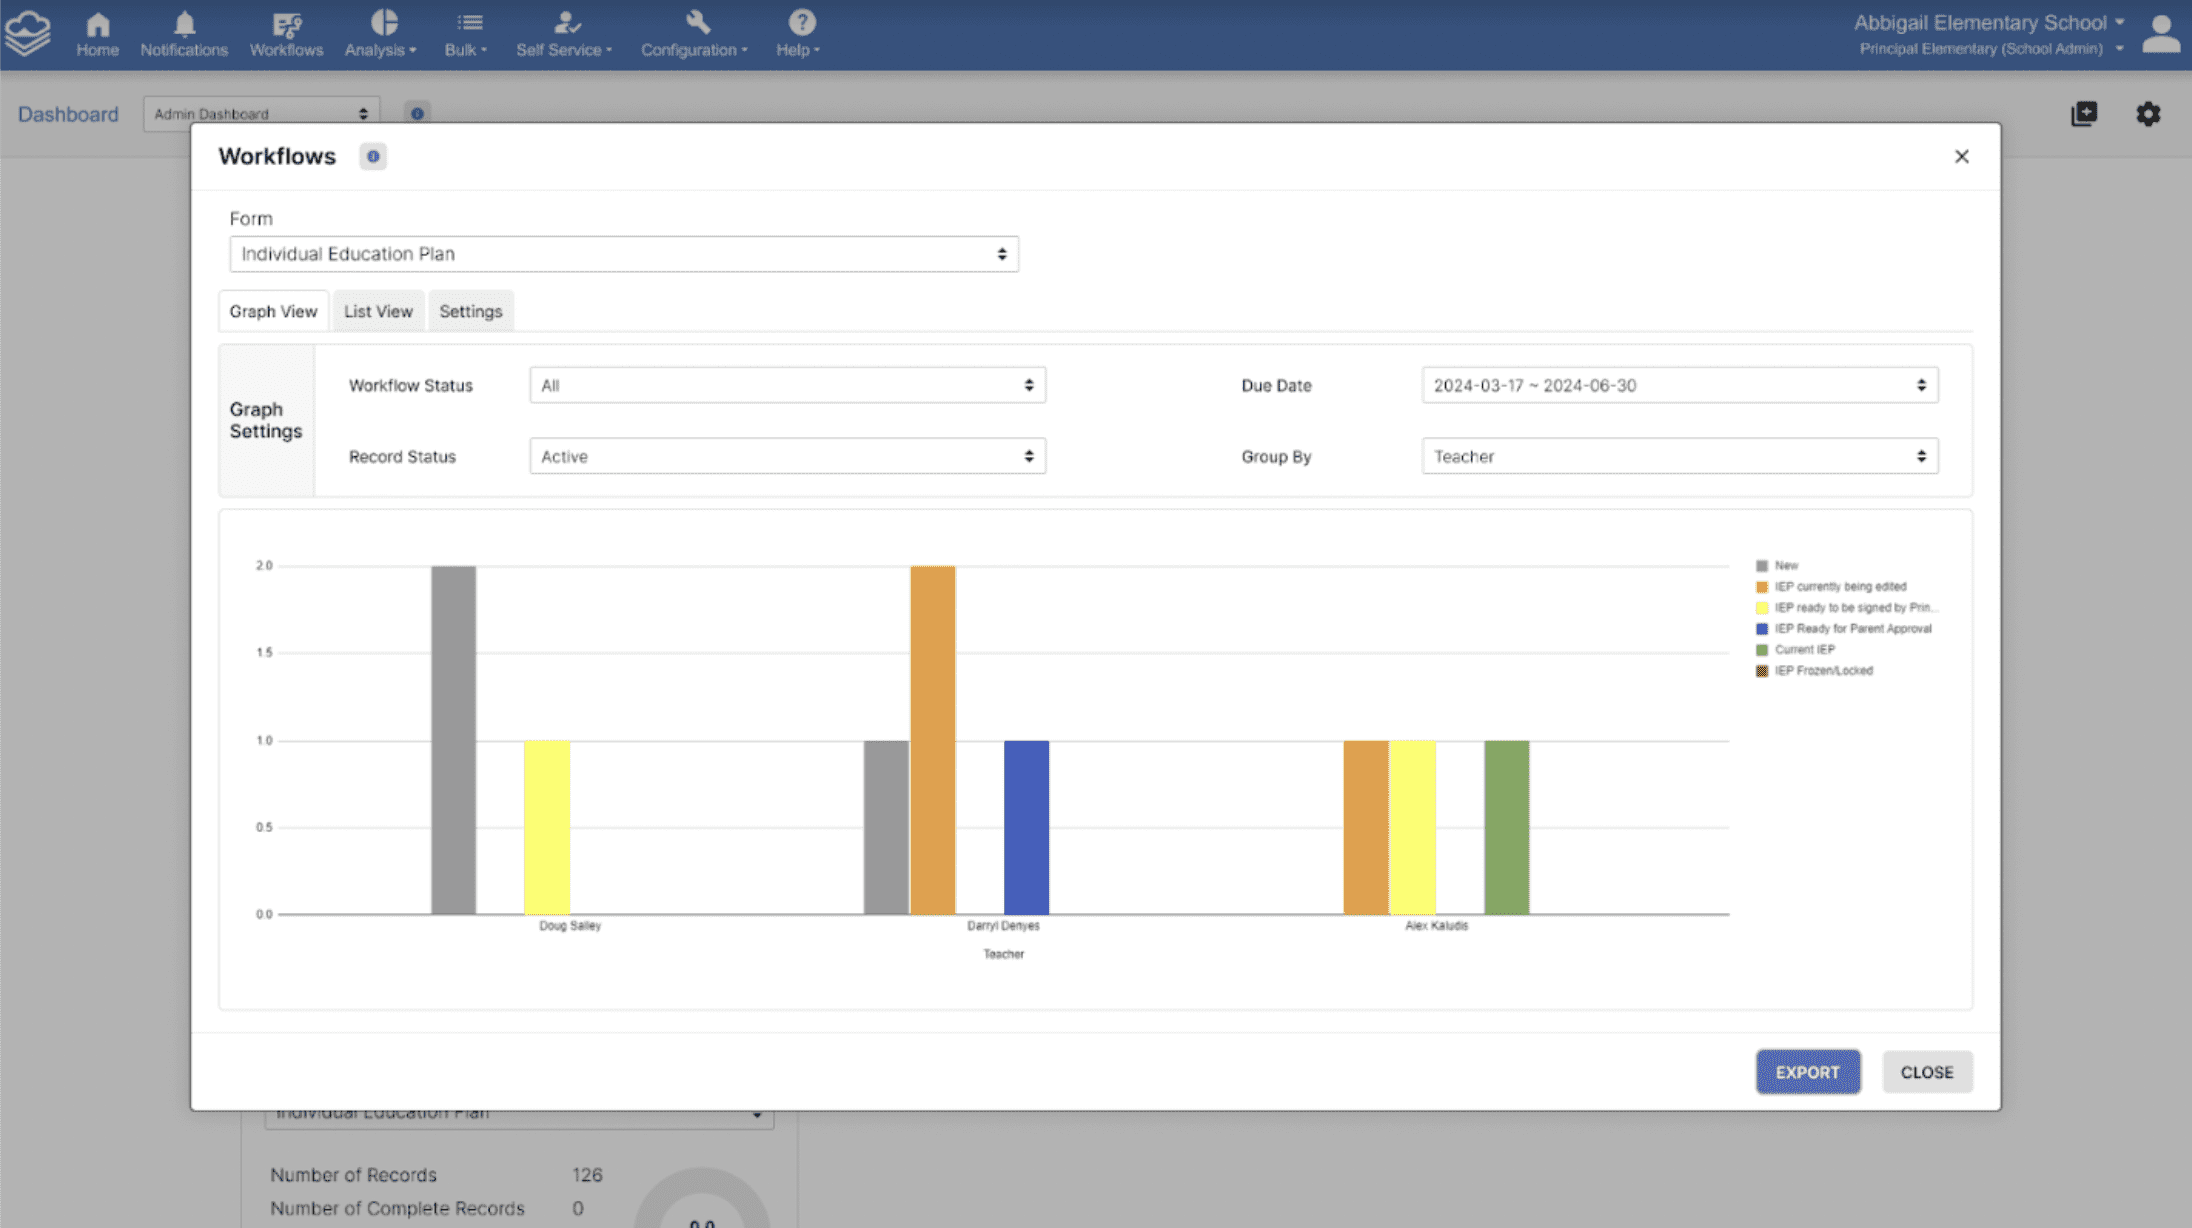
When users log into Clevr, they’re greeted with a personalized dashboard automatically assigned by the district based on their role or department. These role-based dashboards promote consistent information sharing, workflow visibility, and streamlined reporting across teams.

Real-Time Reporting Features

  • Role-Based Dashboards
    Deploy standardized dashboards at scale based on role and department needs.

  • Export Tool 
    Extract any information for specific purposes — either as a one-time process or through automated, scheduled routines.

  • Data Analysis
    Analyze the data captured within Clevr forms to discover patterns, identify trends, and uncover insights that drive improvement.
  • Shareable Reports
    Easily share reports and insights with stakeholders while maintaining security.

  • Personalized Dashboards
    Give staff the freedom to create individual dashboards unique to them without affecting the standard setup.
  • Saved Searches
    Save frequently used filter criteria with unique names and quick access links.
  • Heat Map Visualizations
    Visualize patterns and performance with color-coded data that provides instant insights.

  • Report Editor
    Design effective reports that answer your district’s most pressing questions.
  • Flexible & Customizable
    Customize how your data is displayed using multi-layered filters, grouped views, and sort options tailored to your needs.

  • Dashboard Cards
    Choose from a variety of purpose-built cards like listings, metrics gauges, workflow visualizations and more.

  • Bulk Print
    Generate consolidated PDF reports and batch print multiple reports in an efficient manner.
  • Multiple Formats
    Export reports in various formats including PDF, Excel, CSV, and more to suit your needs.

The information you need at your fingertips

Join leading school districts in making data-informed decisions with Clevr’s powerful reporting tools.

  • Screenshot-2025-04-21-at-4.44.49 PM-1.png
  • Screenshot-2025-04-23-at-1.11.22 PM.png
  • image-5.png

The Clevr Platform enables school districts to create and utilize unlimited electronic forms aligned with their unique needs and local context.